Rethinking Junk Bonds: The Transformation of the High Yield Market
The U.S. high yield bond market, often synonymous with the term “junk” bonds due to their lower credit quality, has undergone a profound transformation.
In the decades prior to the Global Financial Crisis (GFC), corporate borrowers in the high yield market were commonly characterized as having highly levered balance sheets as companies borrowed significant amounts of debt to help finance acquisitions and leveraged buyouts (LBOs) during the LBO-era of the 1980s and Telecom bubble in the late 1990s through early 2000s.
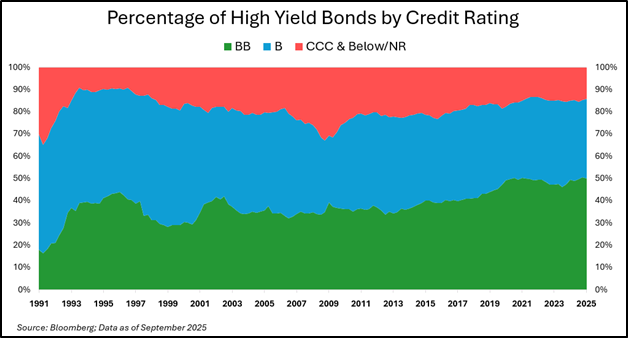
Since the GFC in 2008, the credit quality of the U.S. high yield bond market has improved meaningfully. Many highly levered borrowers have migrated to the leveraged loan market to reduce their cost of debt, while the remaining borrowers in the high yield bond market have made efforts to improve their balance sheets and reduce refinancing risks. As a result, BB-rated issues, the highest rated tier in the high yield spectrum, now comprise more than 50% of the high yield market, up from an average of 33% in the 1990s and 2000s. This shift toward higher quality issuance has coincided with a decline in the number of B and CCC-rated issuers, which once made up the bulk of the market, but now account for just 33% and 14% of the market, respectively.
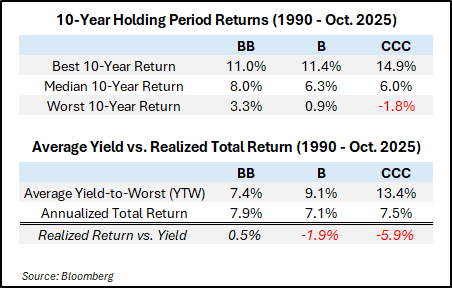
The shift toward higher-quality BB-rated bonds signals a change in the overall risk profile of the high yield asset class. Historically, the lower rated segments (B and CCC) have been the primary drivers of the asset class’s default rate of ~2.5% per year since 2001. Default experience varies significantly by rating: BB-rated bonds have averaged annual defaults of just 0.4%, compared with about 2.0% for B-rated bonds and more than 6.0% for CCC-rated bonds. Despite offering lower yields, BB-rated bonds have generated stronger long-term risk-adjusted returns, as their lower default and loss rates have more than offset their yield disadvantage. Therefore, as the overall percentage of BB-rated issuers has increased, one would expect the future returns of the asset class to also improve due to lower default rates and lower credit losses versus the historical long-term average.
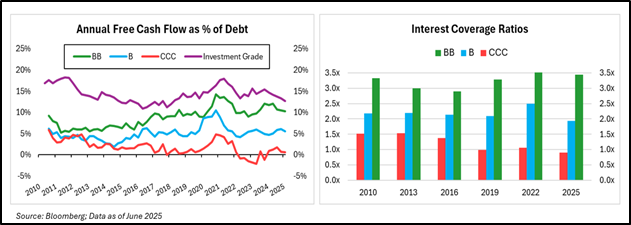
Not only has the percentage of BB-rated bonds increased as a percentage of the overall high yield market, but the quality of BB-rated issuers has also improved relative to lower-rated peers. Since the GFC, BB-rated issuers materially increased their free cash flow as a percentage of overall debt, moving closer to those of investment grade borrowers. In contrast, B-rated issuers have seen little improvement and CCC-rated issuers have declined. These trends are mirrored in interest coverage ratios, a measurement of how easily a company can pay its interest obligations from its current earnings. BB-rated issuers earn nearly 3.5x their current interest expense, compared to just 2x for B-rated issuers, while CCC-rated issuers have fallen below 1x, indicating their current earnings are unable to meet their upcoming interest obligations.
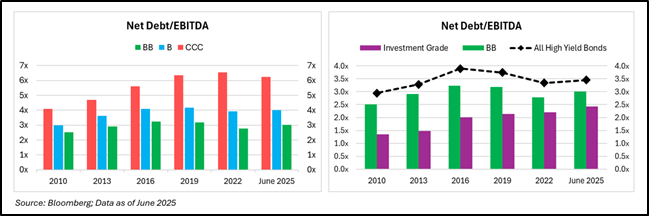
Leverage tells a similar story. BB-rated issuers have seen only a modest increase in leverage, with net debt/EBITDA rising from roughly 2.5x in 2010 to about 3.0x in June 2025, compared with a rise from 3.0x to 4.0x for B-rated issuers and from 4.0x to 6.0x for CCC-rated issuers. This widening gap is even more evident when viewed across the high yield market as a whole, where overall leverage now stands near 3.5x, about one turn higher than investment grade issuers, whose leverage has nearly doubled from 1.3x to 2.4x over the same period.
While many companies increased debt levels during the low-interest rate environment post-GFC, BB-rated borrowers, and B-rated borrowers to lesser degree, appear to have exercised more balance sheet discipline, which may provide more flexibility in the next economic downturn.
In summary, the U.S. high yield market has evolved into a higher-quality, more resilient segment of corporate credit. Improved balance sheets, stronger cash flow generation, and lower default risk have redefined the asset class, making it a fundamentally different, and arguably more strategic allocation for investment portfolios.
This information is intended for institutional use only. Performance and allocations are for informational purposes only and does not constitute an offer to sell or a solicitation of an offer to buy any securities or investment products. It is intended for the exclusive use of the person(s) to whom it was provided.